1 Theme: Point Pattern Analysis
2 Abstract
The Spatial Bros is created to assist non-technical savvy users in performing geographical point pattern analysis. Our application will assist users with 2 kinds of analysis as shown:
Spatial Points Analysis
Network Constraint Spatial Point (Network KDE)
1st and 2nd Order Kernel Density Estimation (KDE)
For each of the analyses, the application will provide users with kernel density maps, 1st and 2nd order will provide and perform types of hypothesis testing to allow users to generate insights towards statistical conclusions on the distribution of spatial points along networks.
3 Problems & Motivation
In today’s technological advancing world, there are many interesting spatial data sources that exist in the forms of Geospatial and Aspatial format. Geospatial data is the foundation based on the foundation of geographical boundary locations and Aspatial data are the observations recorded that can be used to generate derive insights.
The City of Melbourne has many datasets that are readily available to the public, through City of Melbourne Open Data and Data Vic. Yet, this only fufills the first part of ‘data access’ by providing datasets on their websites available for download and simple spatial points exploration using the interactive map provided.
Users who are not trained in geospatial analysis or GIS are unable to perform their own analysis to understand spatial pattern or trends behind their neighbourhood which could help citizens or outsiders to understand the city better and possibly formulate citizen efforts.
These are important pointers as the true democratisation of data should allow users to be empowered with tools to comfortably analyse datasets with ease and come up with their analysis and conclusions.
Hence, our group’s main focus is to perform our analysis and develop a web-based geospatial tool using R Shiny with regards to Point Pattern Analysis particularly on Network-Constrained Point Pattern Analysis (NCPPA) and 1st/2nd Order Kernel Density Estimation (KDE). We hope this application can empower and educate users and conduct the analysis they want regardless of their technical expertise to gain further insights from geospatial data.
4 Project Objectives
Throughout the development of this project, our group would like to perform our analysis and develop an analytical application that allow users to:
Better understand the capabilities of Network-Constrained Point Pattern Analysis
Better understanding of 1st Kernel Density Estimation (KDE), Clarks and Evans Test and 2nd Order (G,K) function analysis
Conduct Network-Constrained Point Pattern Analysis density estimation (NetKDE) and (G, K) function analysis
Ability to generate insights based on the above analysis for any decision making
5 Our Approach & Methodology
5.1 Data Preparation
To source and assemble data from various sources out there
Importing the Spatial Data (Geospatial)
Data Wrangling
5.2 Exploratory Data Analysis
Visualise and examine the distribution of spatial pointers
Examine any anomalies and outliers in the dataset sourced
Further Data Wrangling (where necessary)
5.3 Network Constrained Point Pattern Analysis
Network Kernel Density Estimation - To explore the intensity of points along network
G and K function - To identify any potential clustering patterns, random distributions, even or uneven distributions of patterns
5.4 1st & 2nd Order Kernel Density Estimation
1st order Kernel Density Estimation
Clarks Evans Test
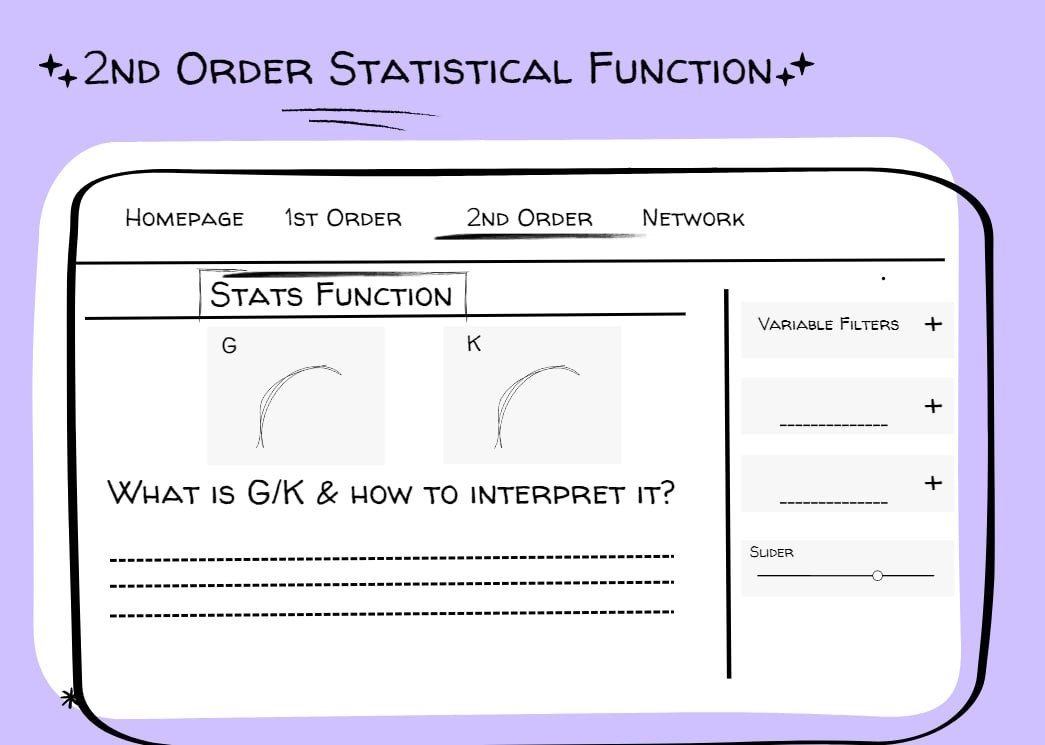
2nd Order G and K function analysis
5.5 User Interface and Design
Allow users to use the Interactive Shiny App easily, even without the user guide
Instructions on interpretation of results will be provided on each individual KDE or statistical analysis page to allow users to understand results and formulate their conclusions
Explanations of what each function and method that users are allowed to select for them to understand how each function/method works
7 Story Board
7.1 Home Page

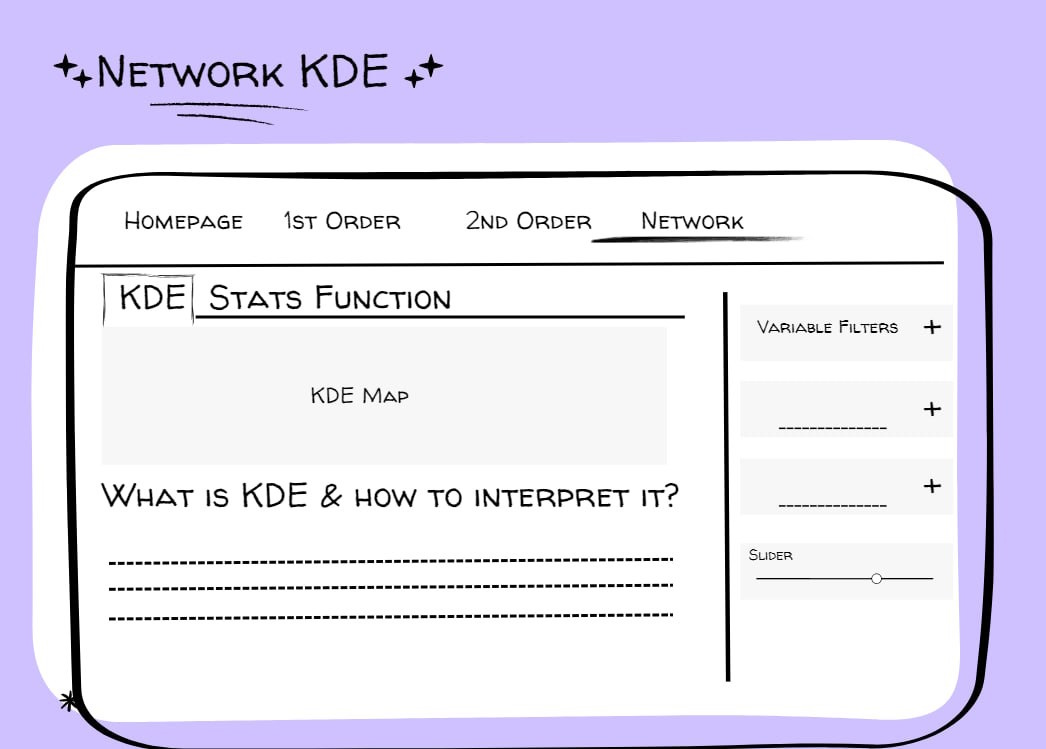
7.2 Network KDE
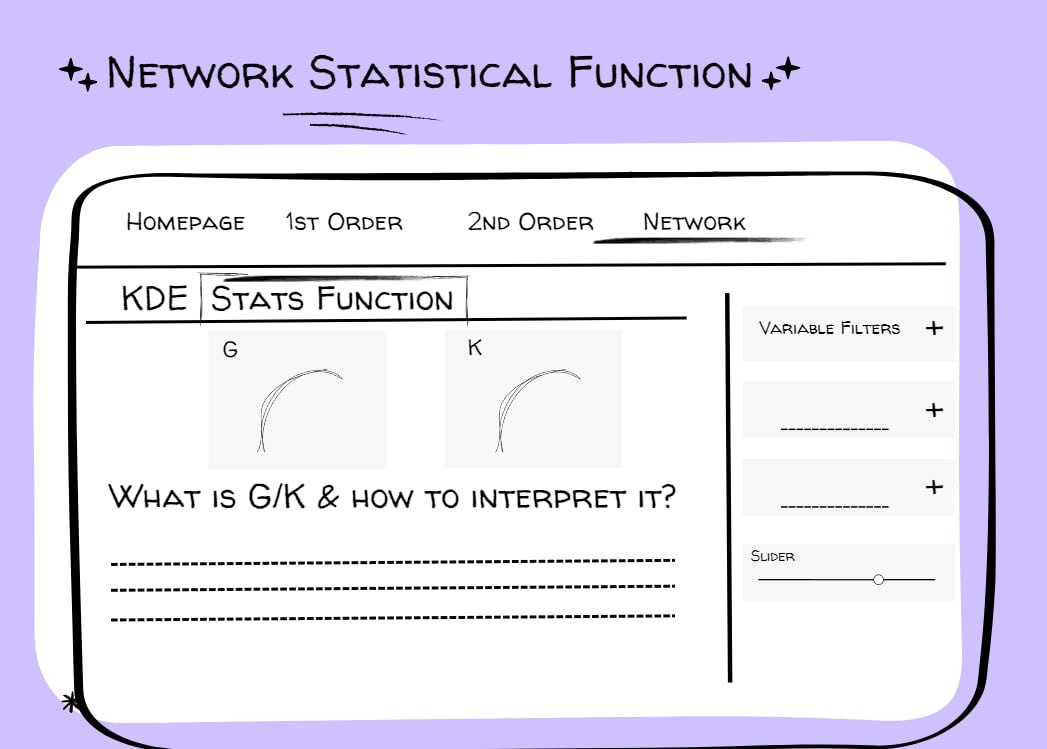
7.3 Network Statistical Function
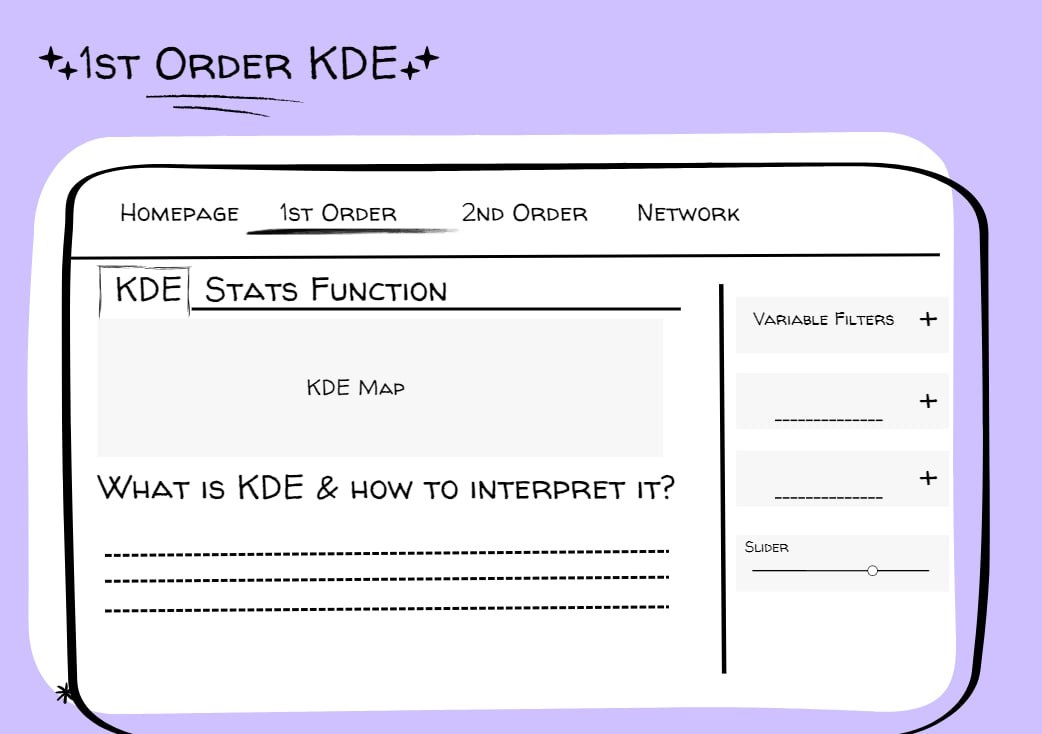
7.4 1st Order KDE
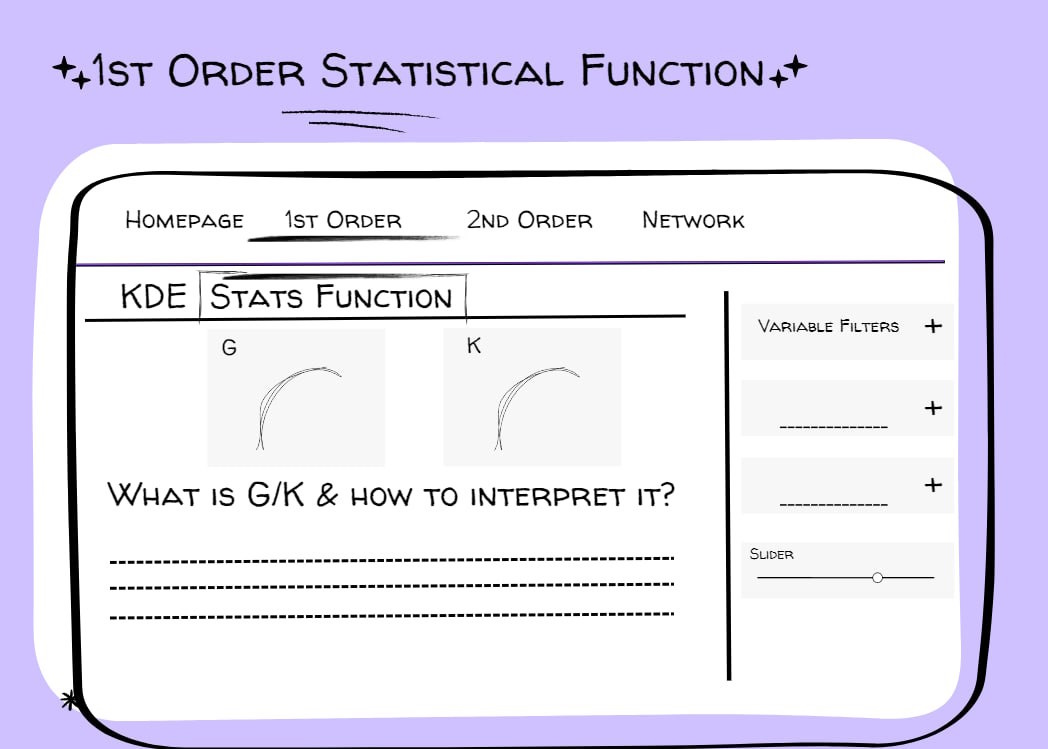
7.5 1st Order Stat Function
7.6 2nd Order Stat Function
8 Data Sources
Our data sources includes datasets from Australia Bureau of Statistics, City of Melbourne Open Data and Data Vic (State Government of Victoria) due to its large and wide range of datasets available for exploration and analysis.
With the inclusion of three different Network datasets in Melbourne and various Spatial Points datasets, we hope to allow users to understand and gain further insight of the use cases of Network-Constrained Spatial Points Analysis and 1st/2nd Order KDE along different networks such as Pedestrian, Roads and Tram Networks.
For example, users could select health services and understand more about geographical accessibility of health services across Melbourne by Road.
They could also select and see accessibility of drinking fountains by pedestrian paths, which could drive further understanding about the distribution of drinking fountains across the city and possibly push for more water fountains to reduce the use of disposable water bottles to be more sustainable.
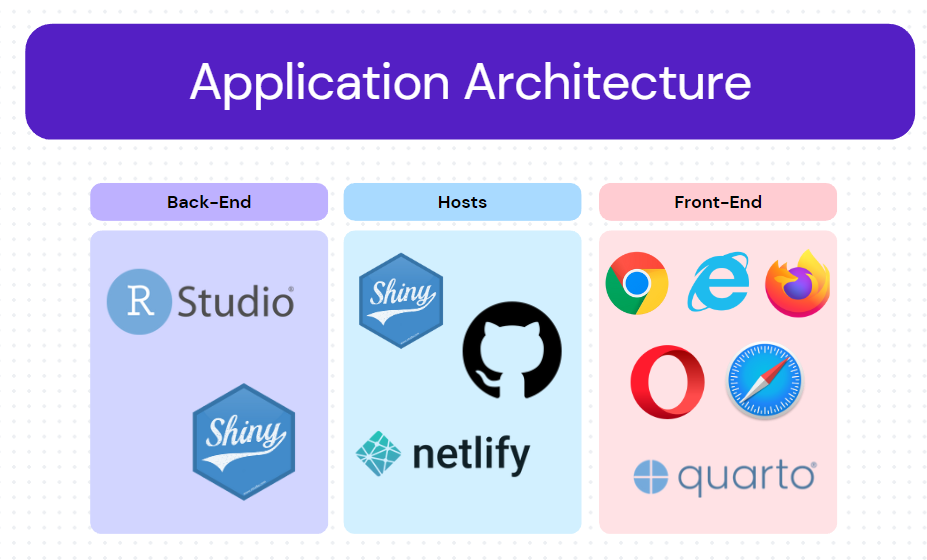
9 Application Architecture
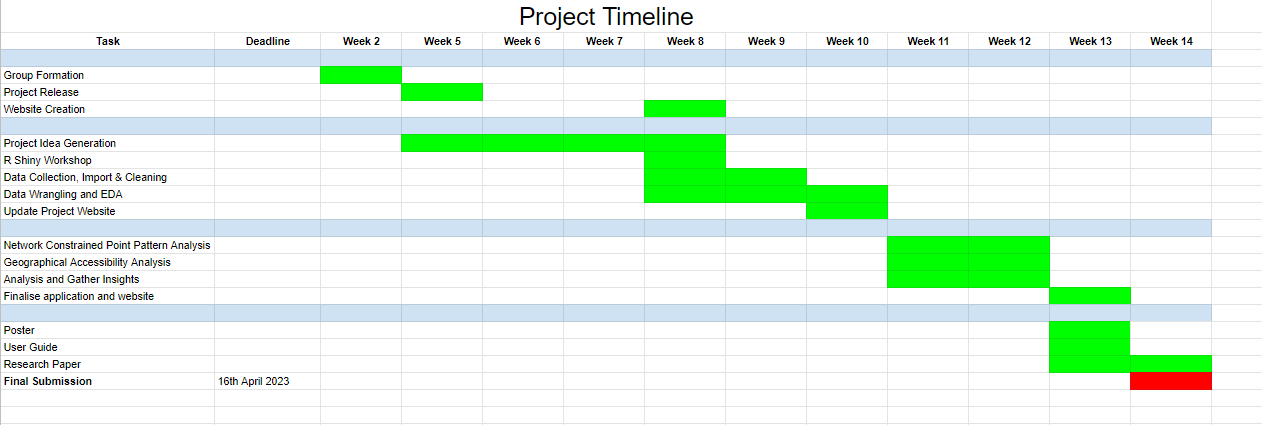
10 Timeline
11 References
- Dr Kam Tin Seong - Course Website and R for Geospatial Data Science and Analytics textbook
- Yikang Rui, Zaigui Yang, Tianlu Qian, Shoaib Khalid, Nan Xia & Jiechen Wang - Network-constrained and category-based point pattern analysis for Suguo retail stores in Nanjing, China
- Olga Špatenková & Alfred Stein - Identifying factors of influence in the spatial distribution of domestic fires